Regression Models in UX Research - Cheatsheet for Practitioners
-
1 min
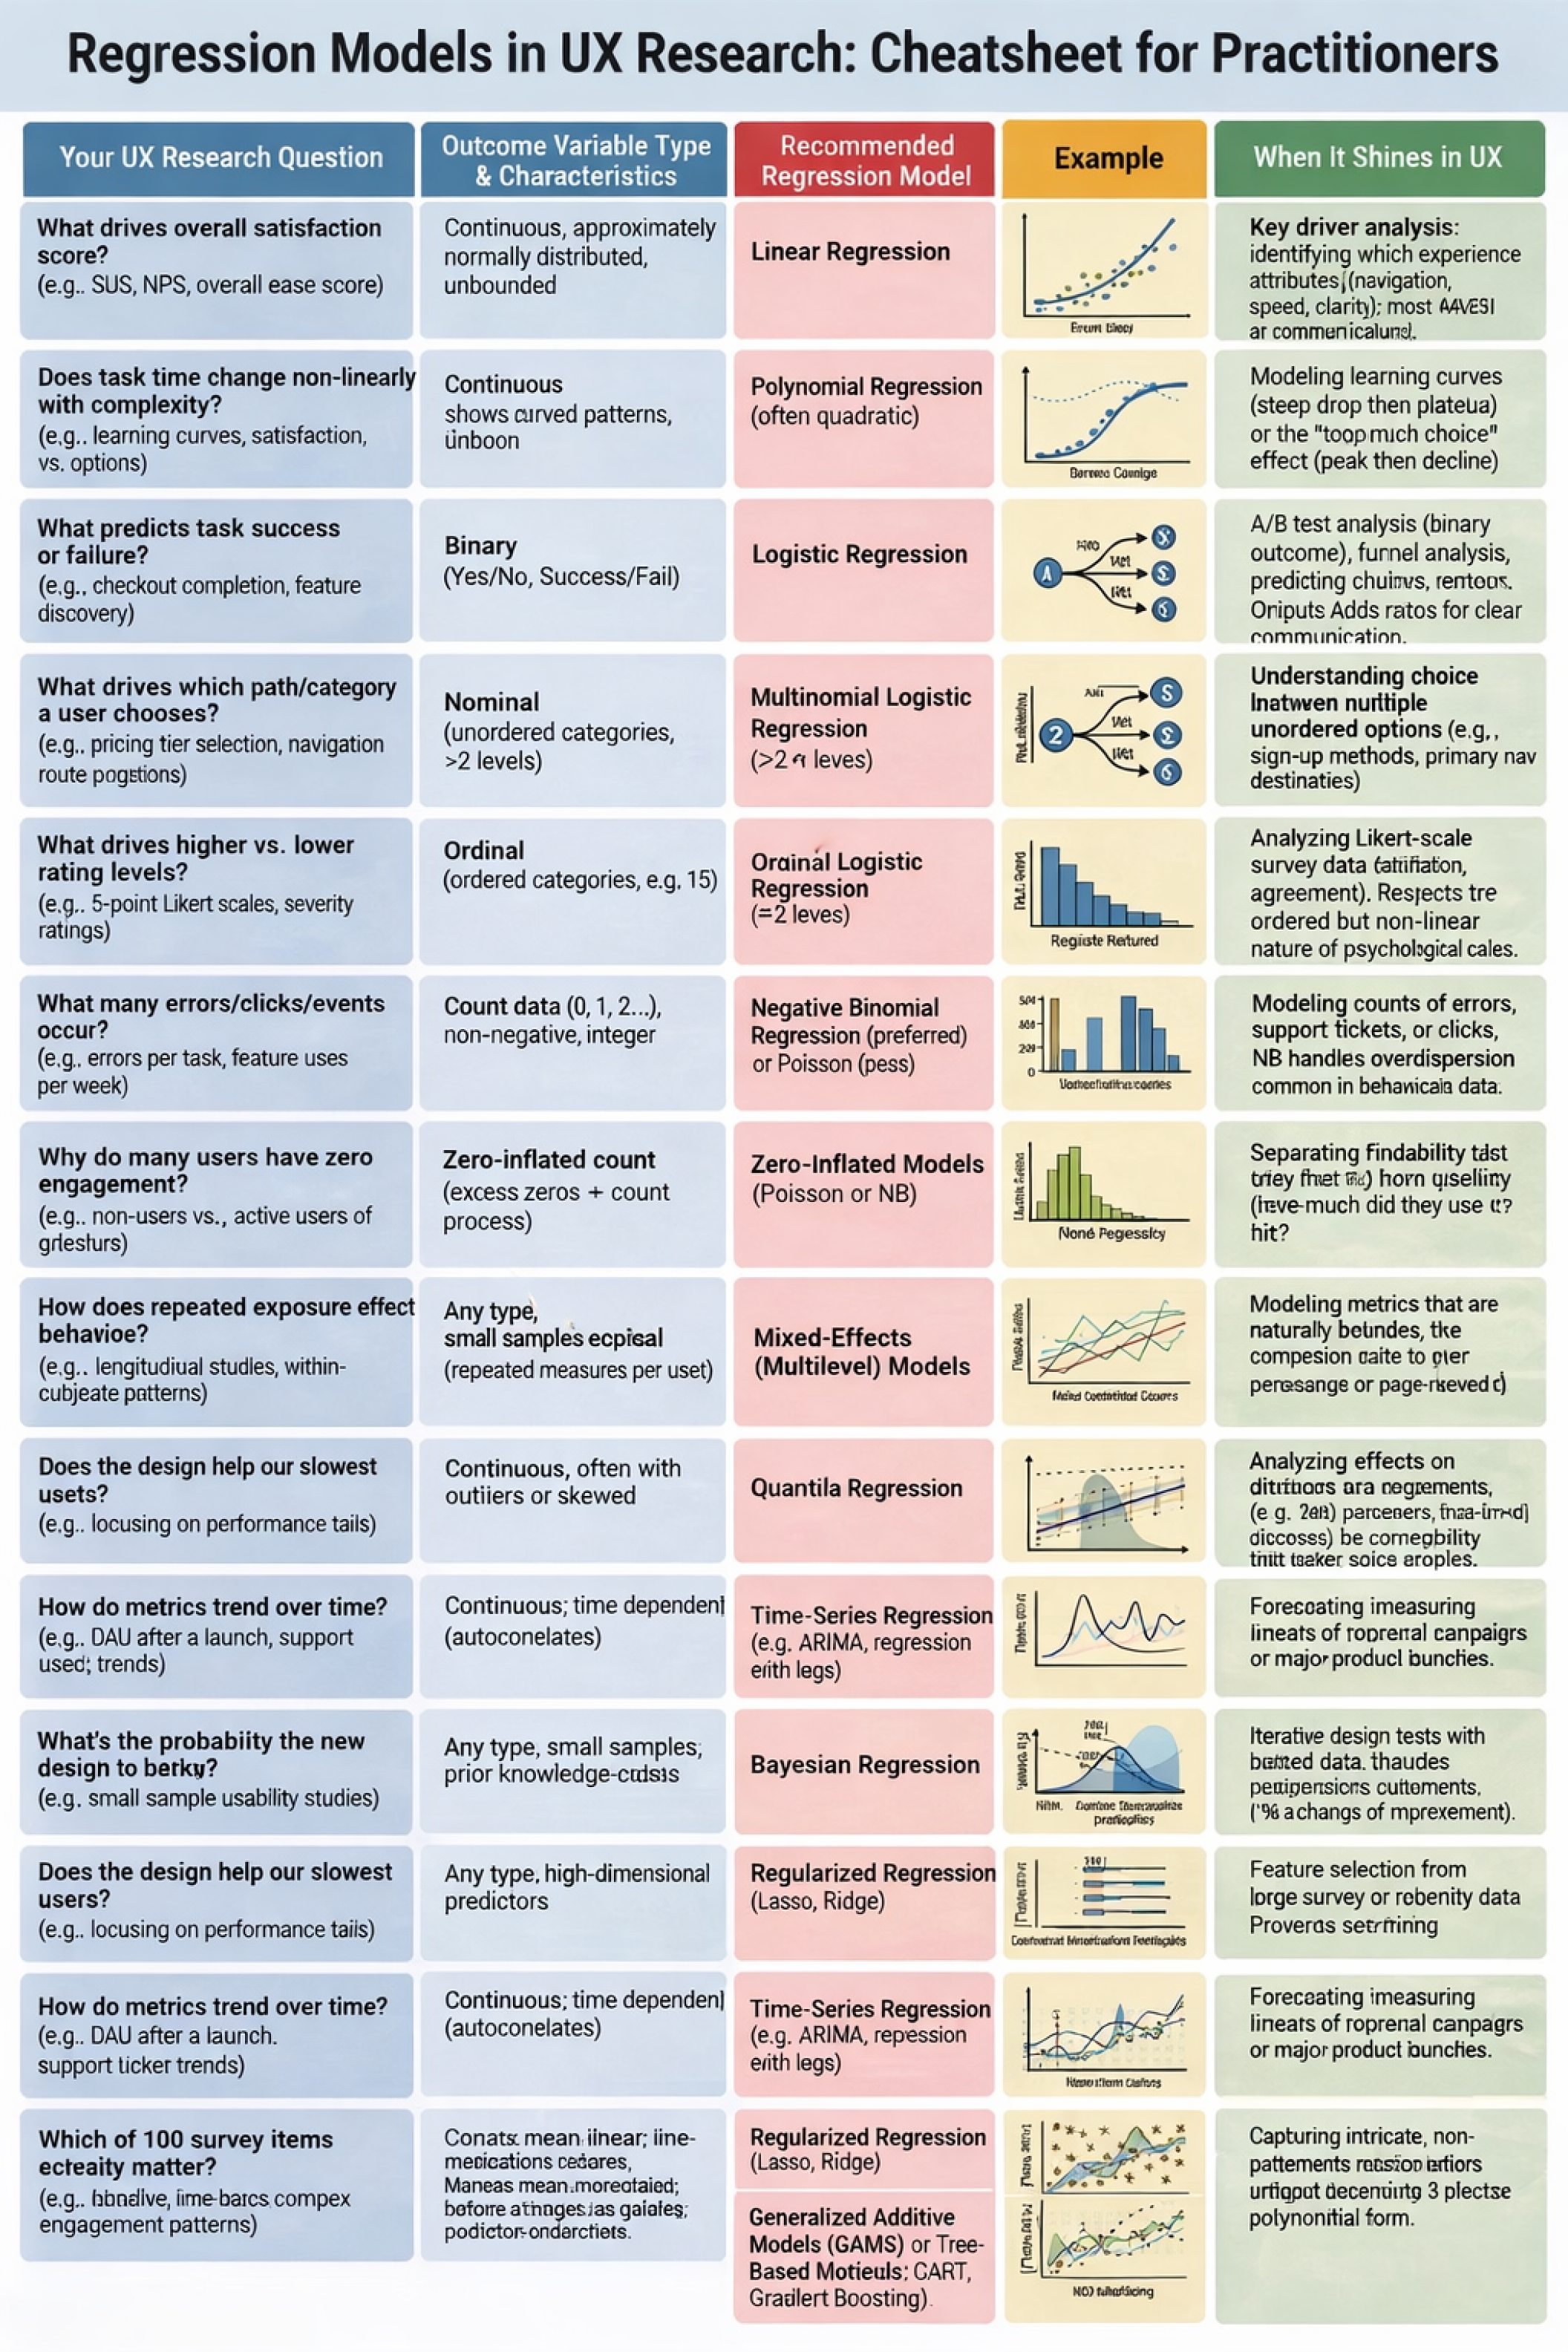
Key Decision Flowchart for UX Researchers
1. Identify your outcome variable.
| Outcome | Recommended model |
|---|---|
| Binary | Logistic Regression |
| Ordered categories | Ordinal Regression |
| Unordered categories (>2) | Multinomial Regression |
| Counts | Check for overdispersion → Negative Binomial |
| Proportion (0–1) | Beta Regression |
| Continuous | Proceed to step 2 |
2. Examine your data structure.
| Data issue | Recommendation |
|---|---|
| Repeated measures / clustered data | Use mixed‑effects (multilevel) version of the chosen model (random intercepts/slopes) |
| Time‑based observations | Use time‑series or temporal models (ARIMA, state‑space, or models with time terms) |
| Many zeros | Consider zero‑inflated or hurdle models (ZIP/ZINB, ZINegBin) |
| Outliers / skewed distributions | Apply transformations or use robust or quantile regression |
3. Define your analytical goal.
| Analytical goal | Recommendation |
|---|---|
| Explain drivers | Use interpretable models (Linear, Logistic, etc.) |
| Predict accurately | Consider regularized or machine‑learning models (Lasso, GAMs, Boosting) |
| Inform design decisions | Prioritize models with communicable outputs (odds ratios, probabilities) |
Regression Models Cheatsheet in UX Research